Thao Duyen Tran

I am an aspiring data science student. Currently pursuing the Master of Science in Data Science, Analytics at Northeastern University. I love to use algorithms to analyze data and explore interesting and meaningful findings in business and socioeconomics settings.
Portfolio
Data Science & Technology Innovation
Data Science Projects
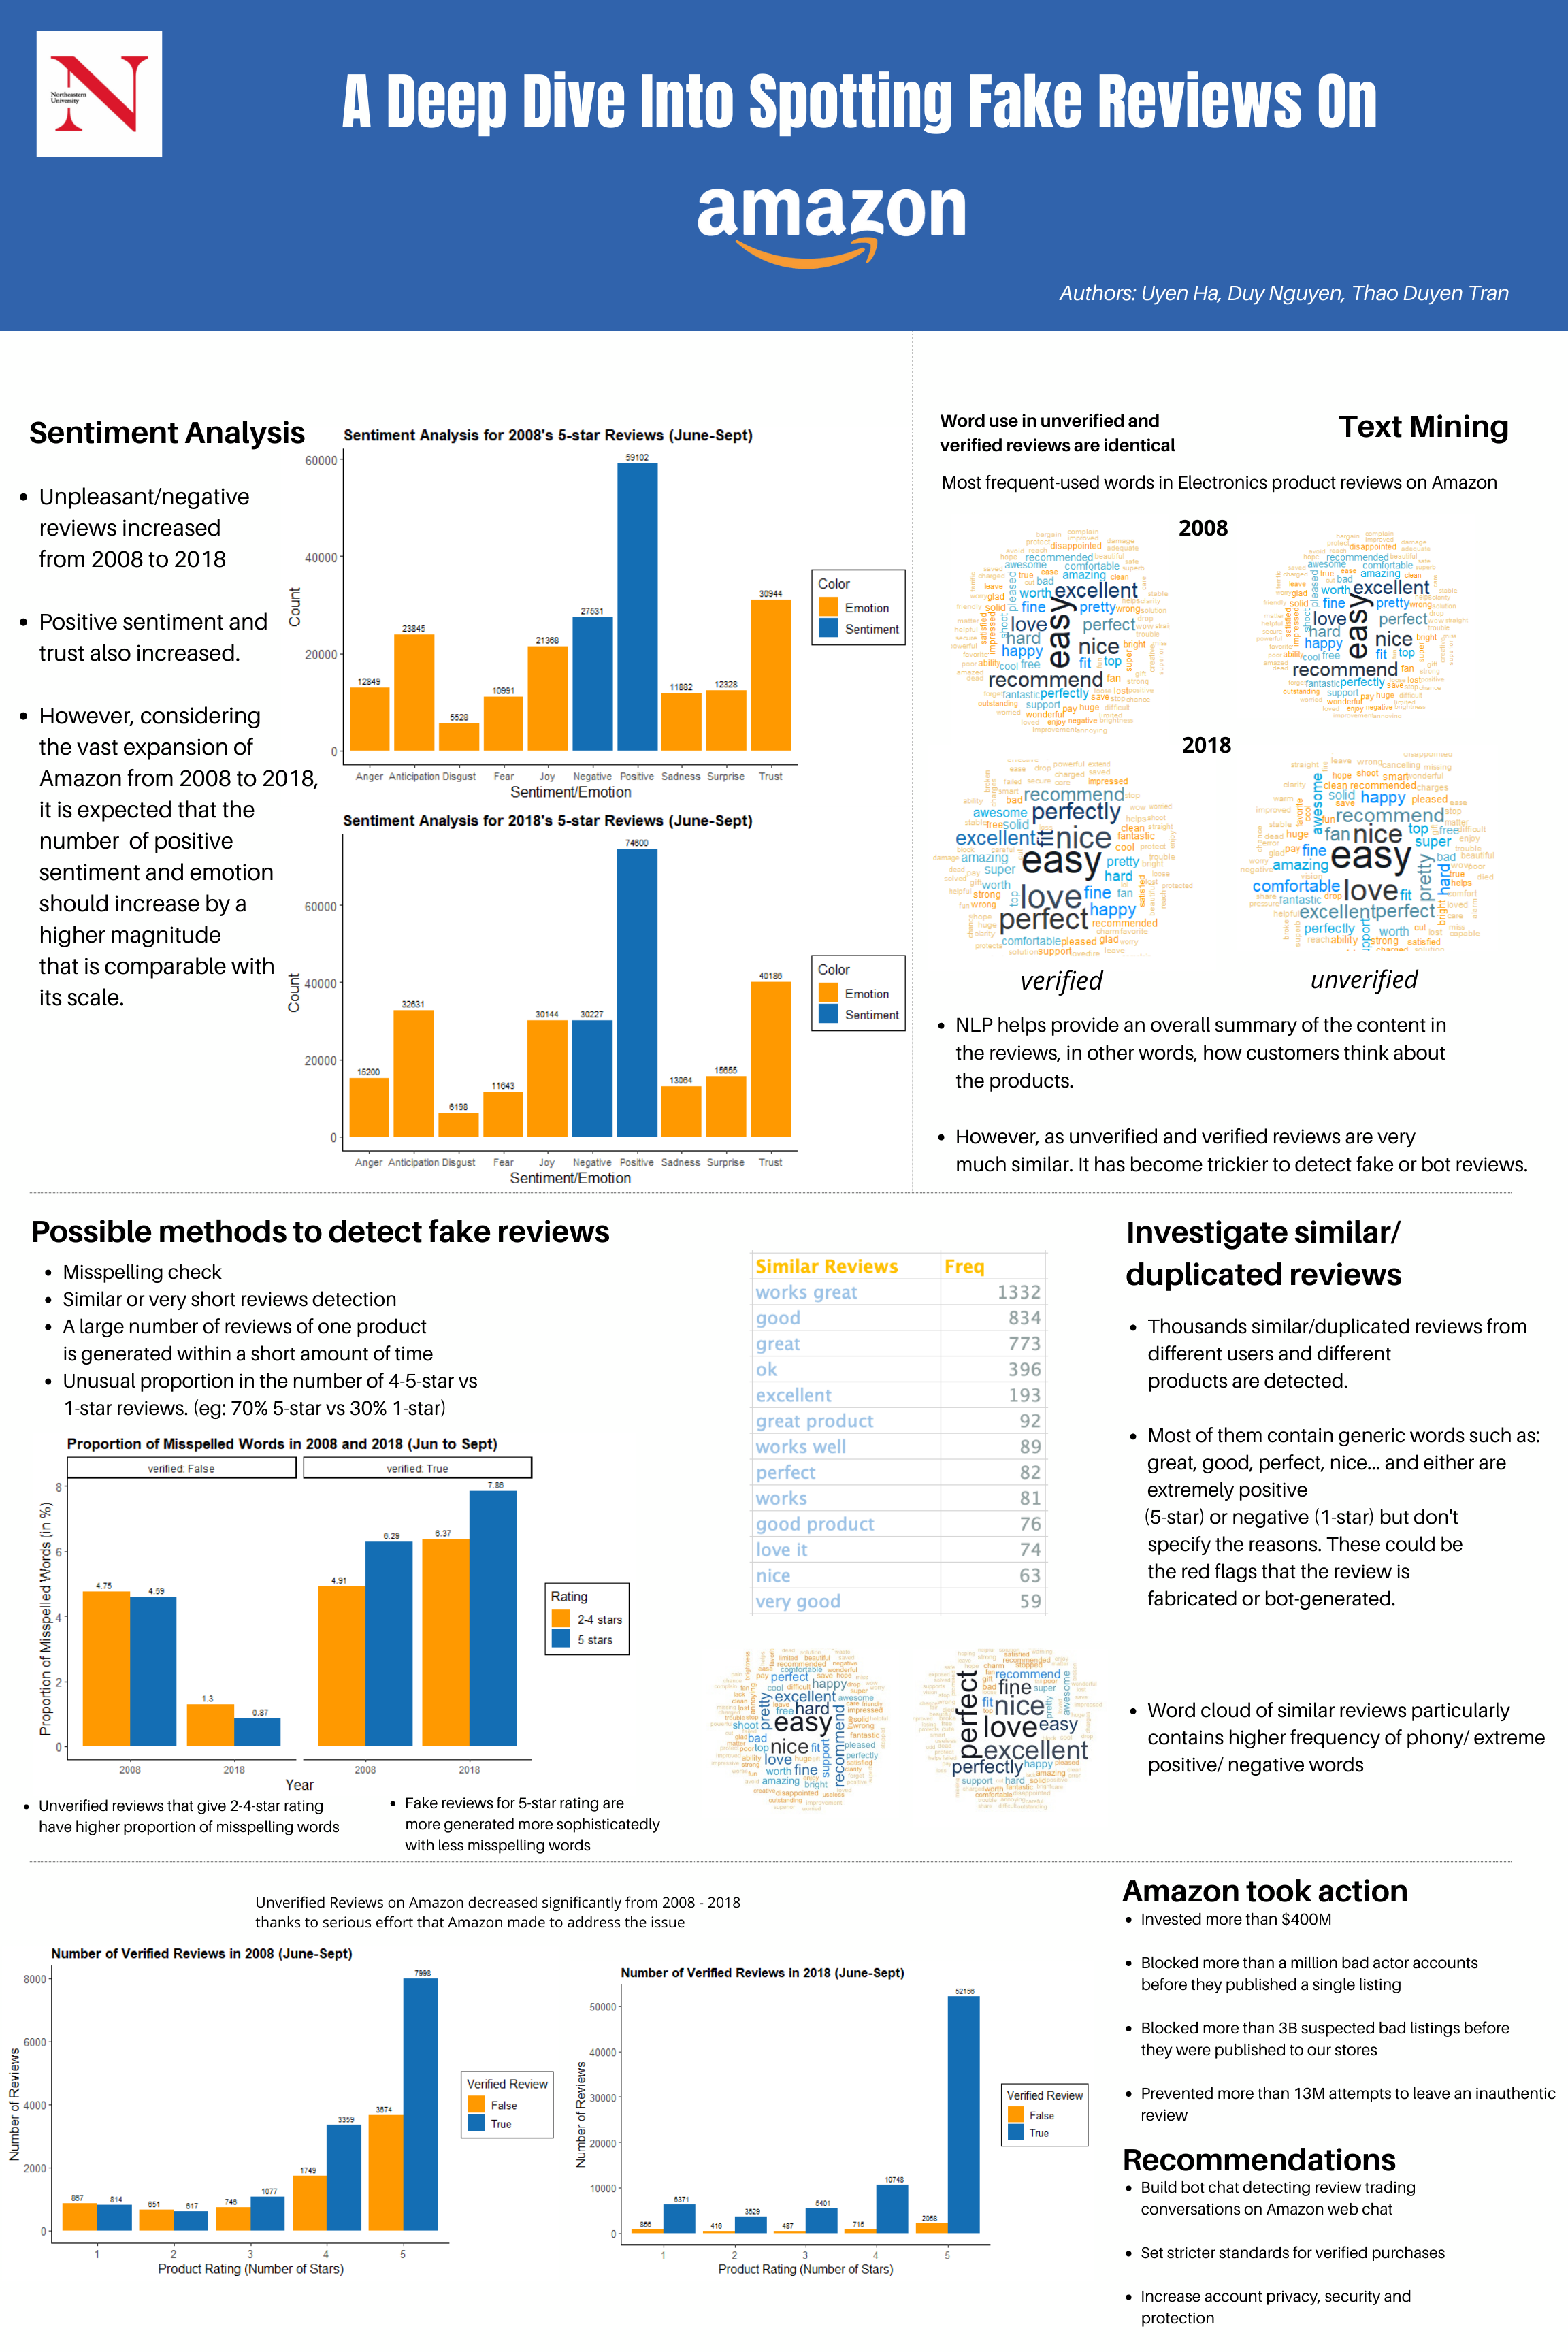
A Deep Dive Into Spotting Fake Reviews on Amazon
Fake reviews on Amazon has always been a pressing issue as E-commerce rises over the last decade. We wanted to dig deeper in the text reviews by using Natural Language Processing to conduct text mining, text analysis and sentiment analysis to have a better understanding of the issue as well as find a feasible way to detect fake reviews. Further, we want discover the classification algorithm Amazon used to categorize their verified/unverified reviews and compare it to our findings based on text analysis.
The Economic Value of College Majors
Education is usually considered a long-term and low-risk investment for most people. However, without proper research and analysis about employment outcome and the salary range of a chosen major, the ROI in higher education could disappoint students with unrealistic expectations. I conduct this analysis to provide useful insights about the short- and long-term financial implications of college major decision.
Comparison in Starting vs. Mid Career Median Salaries.
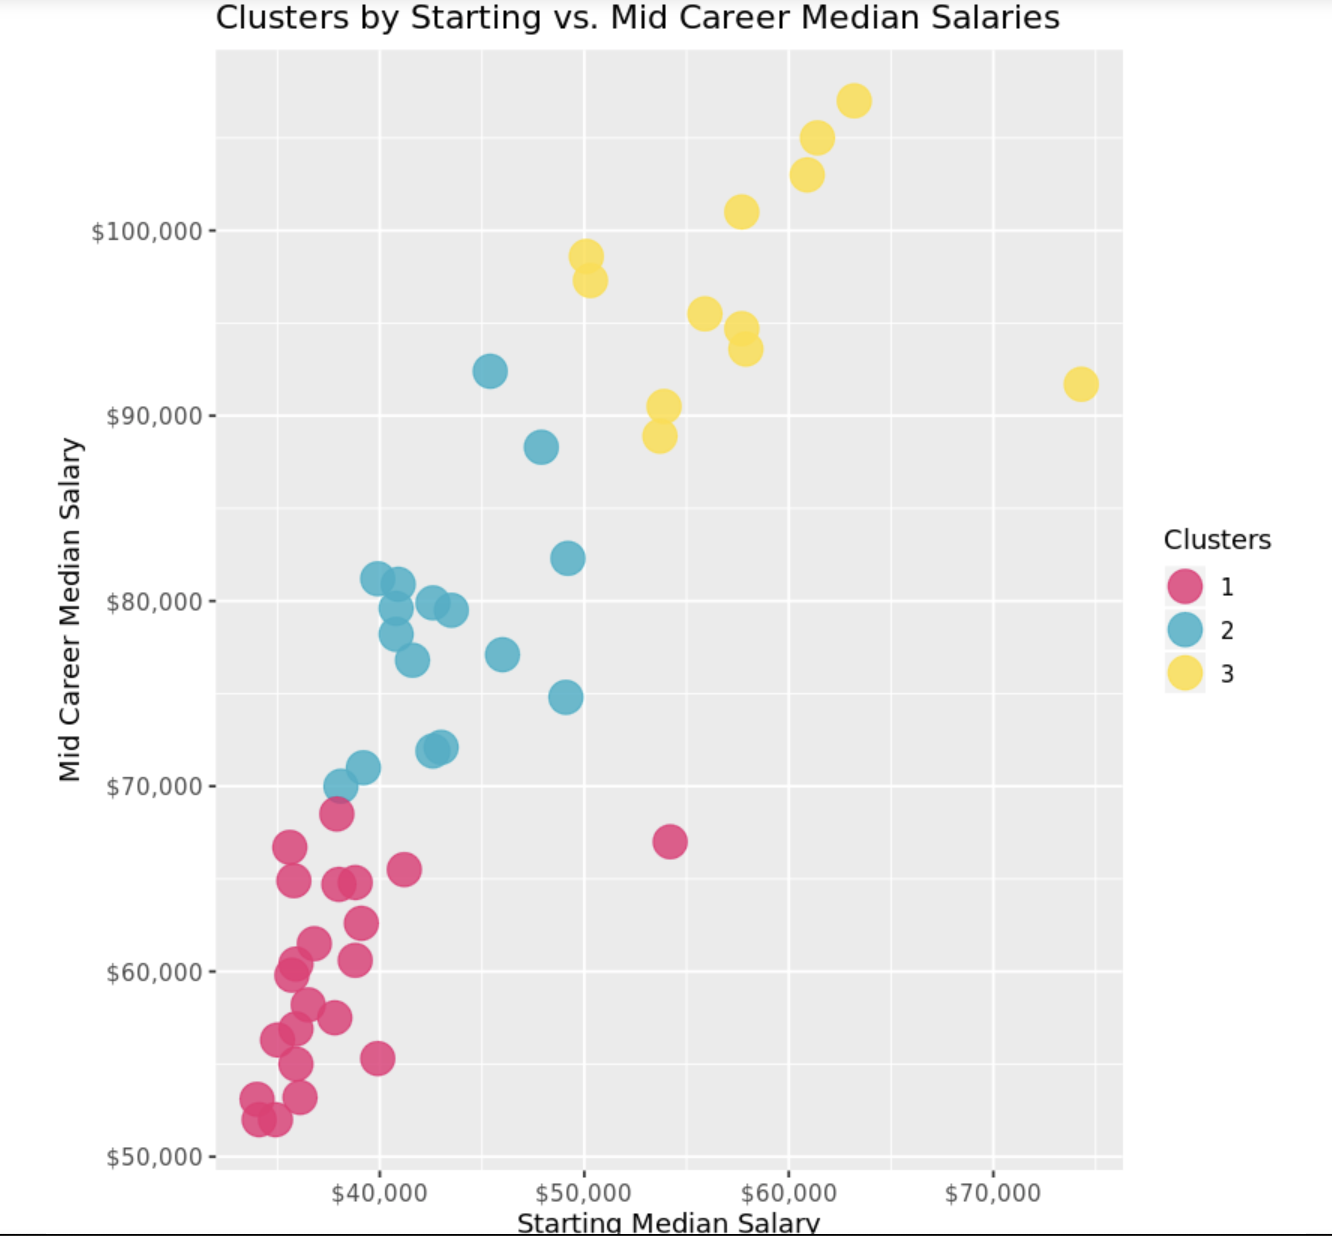 The data collected from a year-long survey of 1.2 million people with only a bachelor’s degree by PayScale Inc., made available here by the Wall Street Journal for their article Ivy League’s Big Edge: Starting Pay. I compared the recommendations from three different methods for determining the optimal number of clusters, apply a k-means clustering analysis, and visualize the results.
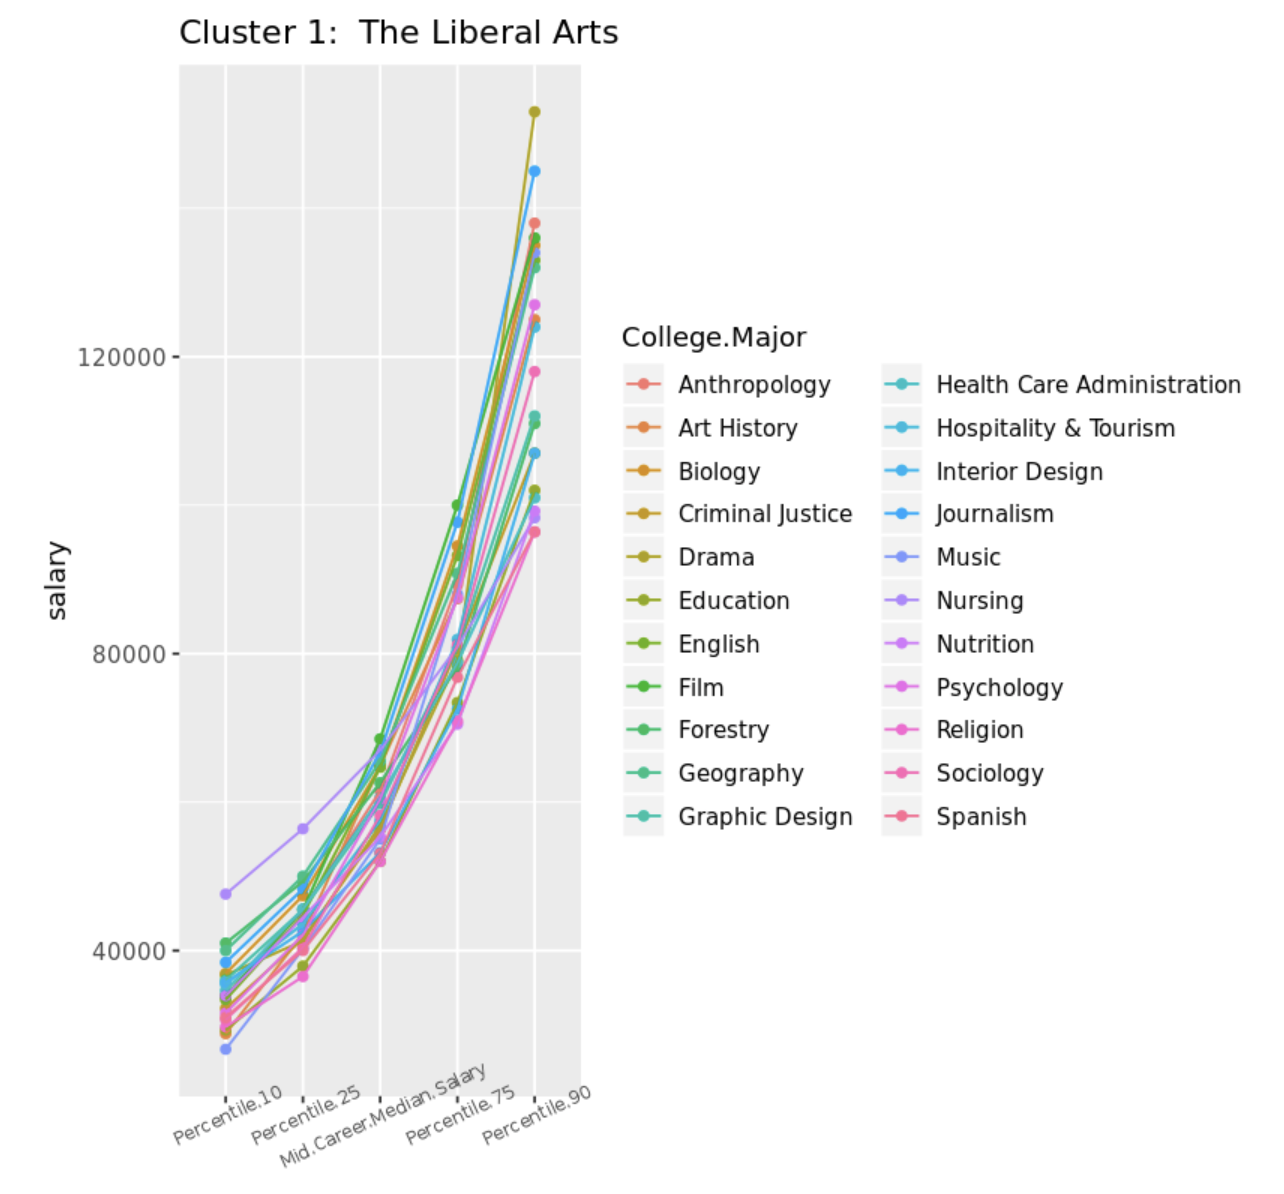
A deeper dive analysis into the clusters
The data collected from a year-long survey of 1.2 million people with only a bachelor’s degree by PayScale Inc., made available here by the Wall Street Journal for their article Ivy League’s Big Edge: Starting Pay. I compared the recommendations from three different methods for determining the optimal number of clusters, apply a k-means clustering analysis, and visualize the results.
A deeper dive analysis into the clusters
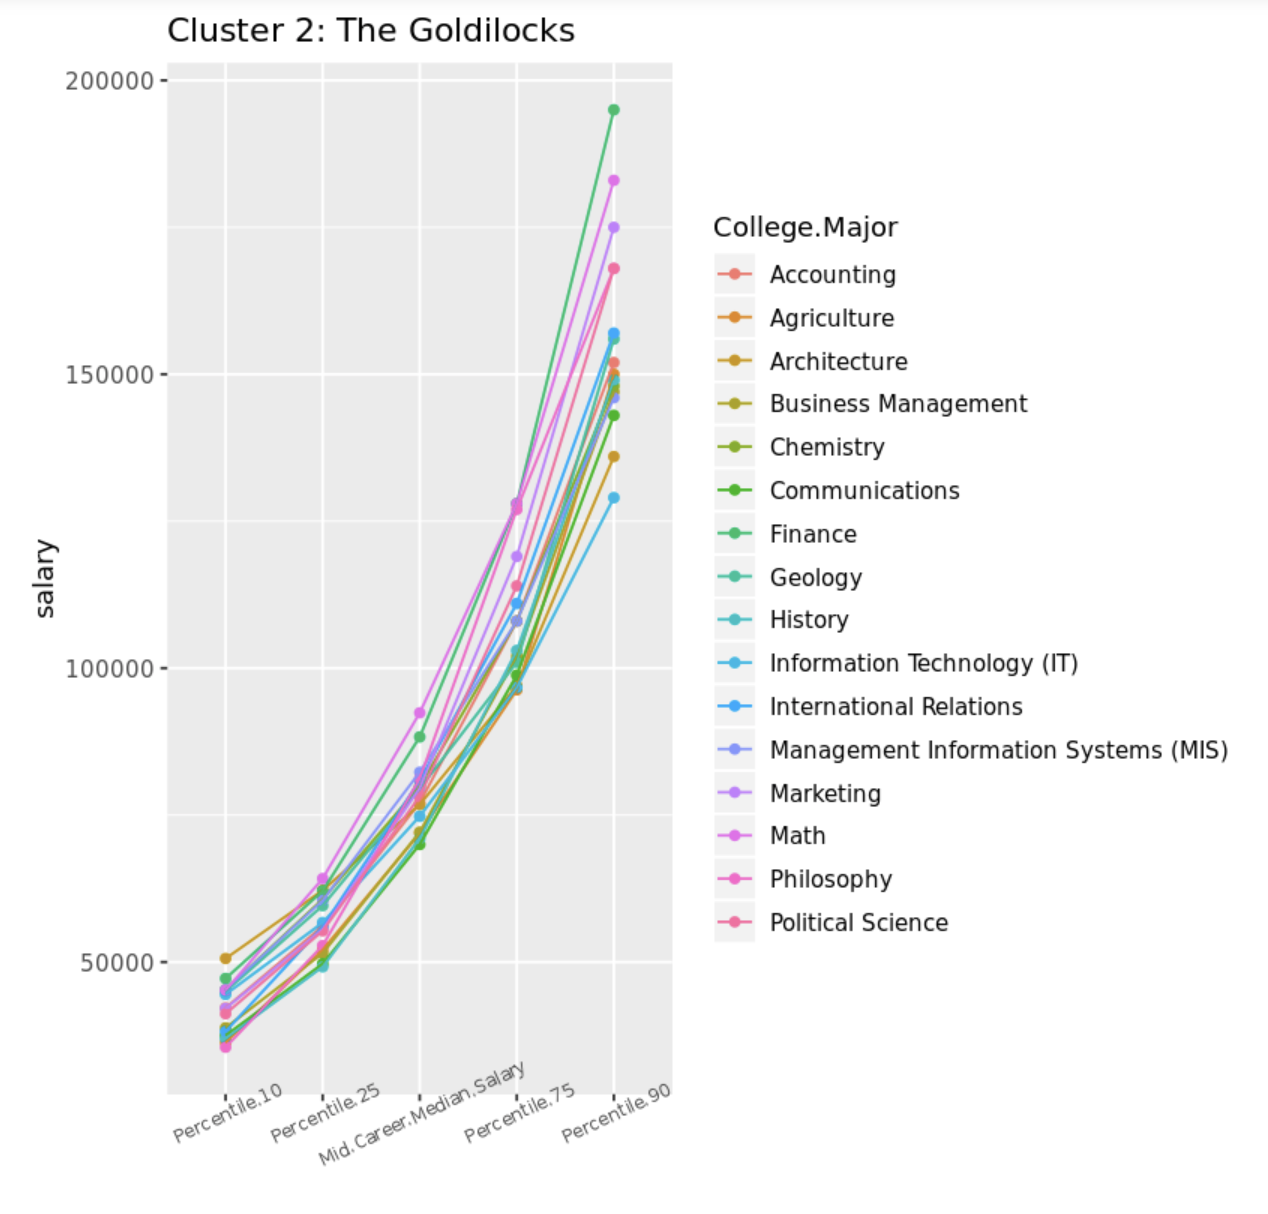
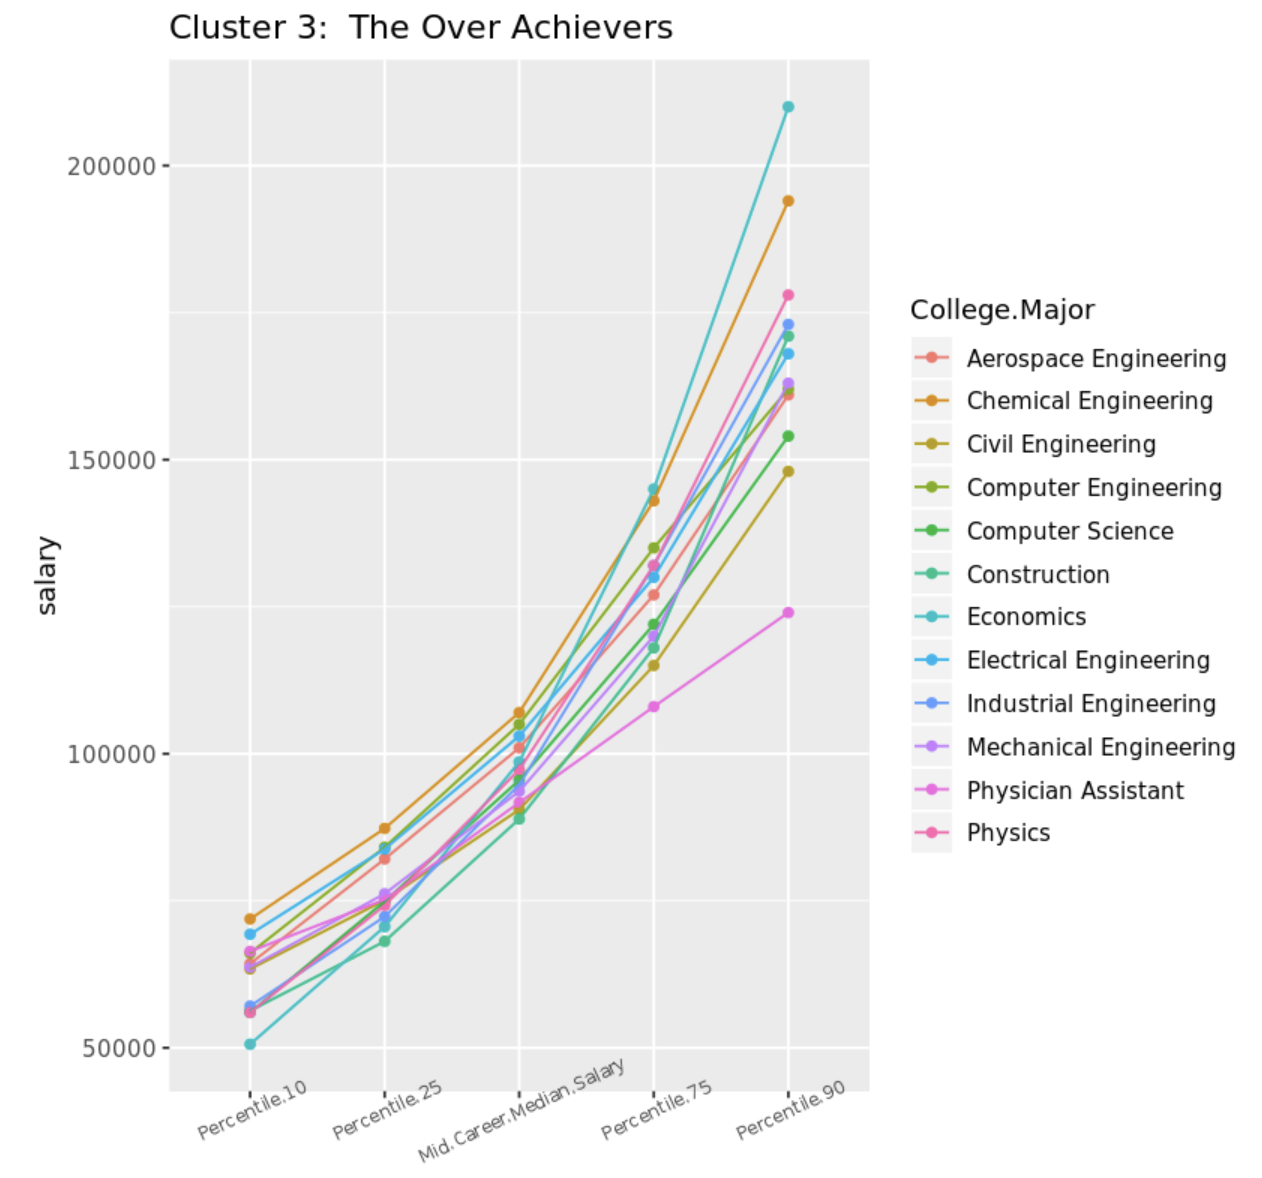 Detailed statistics. You can identify the majors with the highest career percent growth.
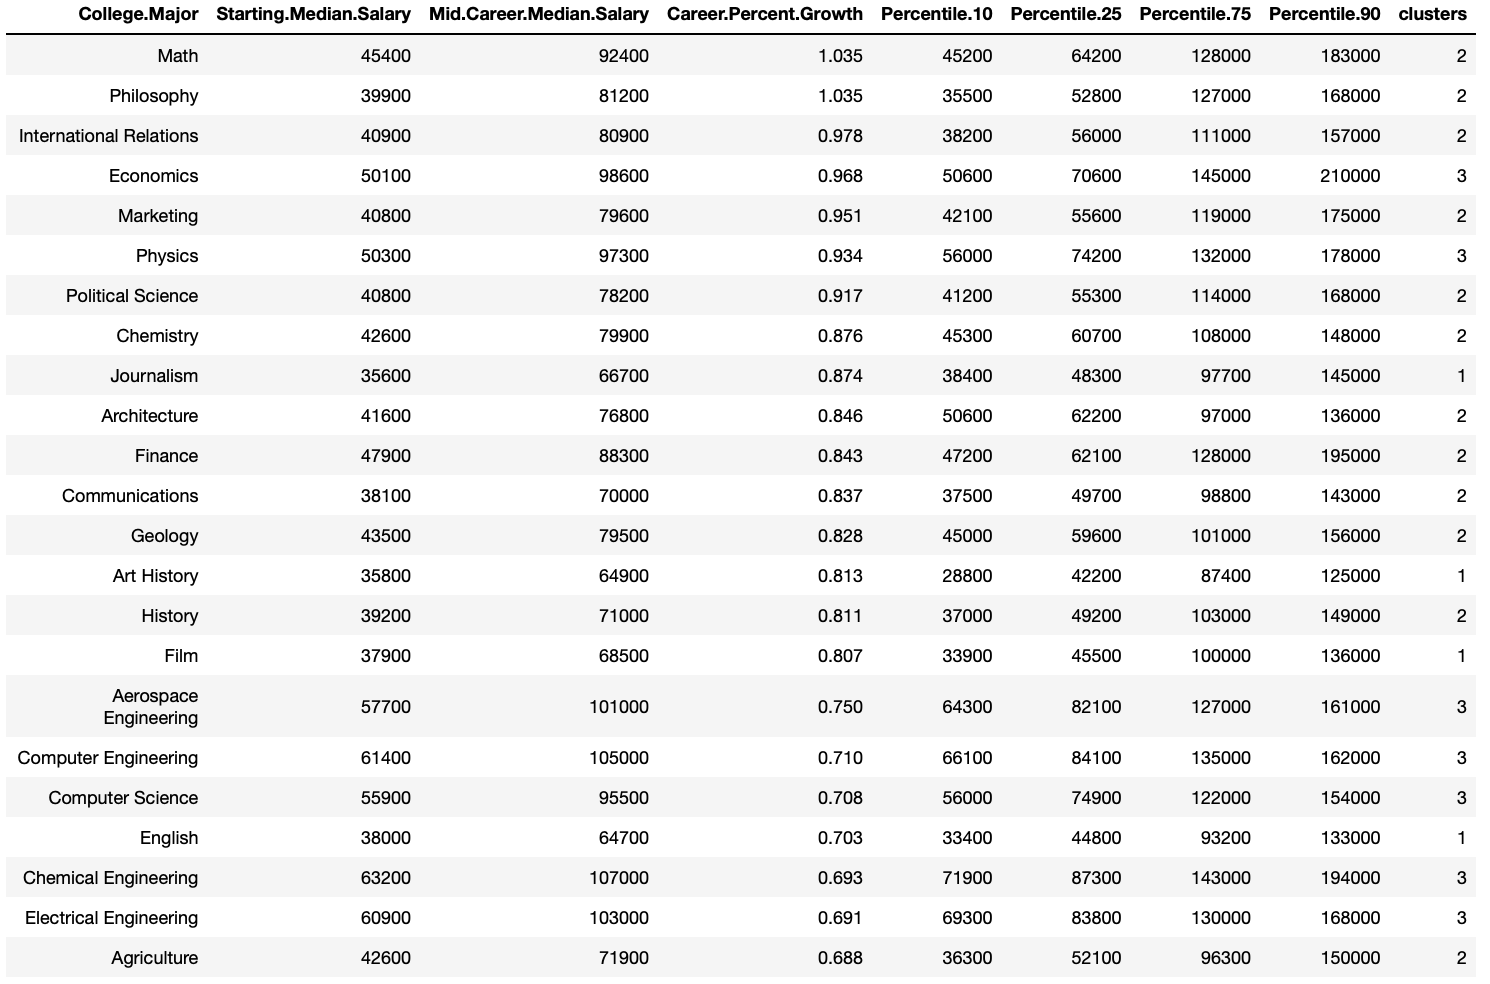
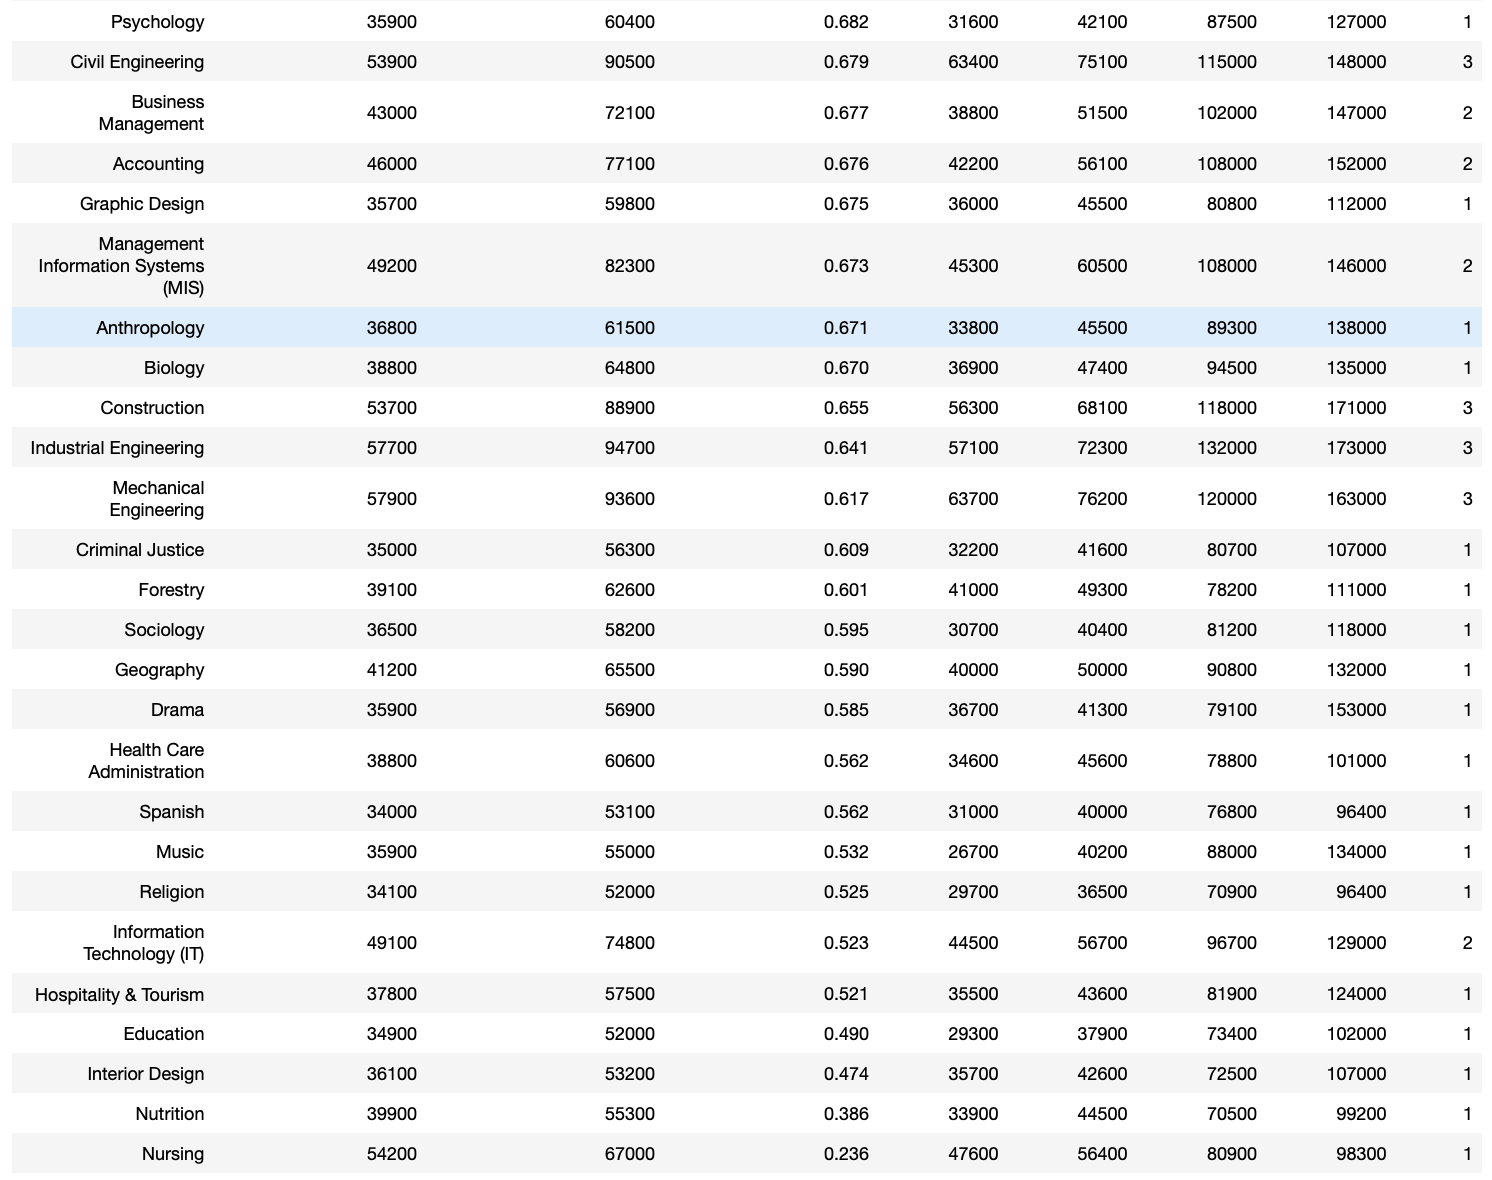
Conclusion
While it’s tempting to focus on starting career salaries when choosing a major, it’s important to also consider the growth potential down the road. Keep in mind that whether a major falls into the Liberal Arts, Goldilocks, or Over Achievers cluster, one’s financial destiny will certainly be influenced by numerous other factors including the school attended, location, passion or talent for the subject, and of course the actual career(s) pursued.
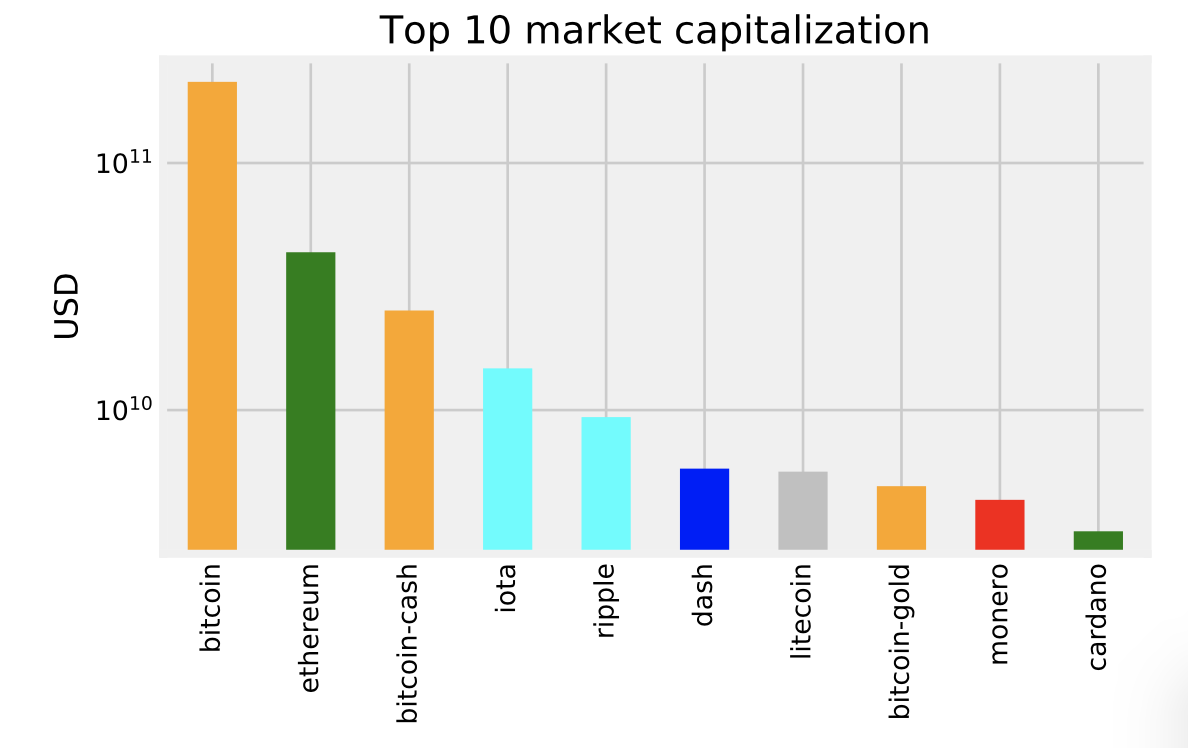
Bitcoin & Cryptocurrency Market Capitalization
Compare bitcoin market cap with other cryptocurrencies
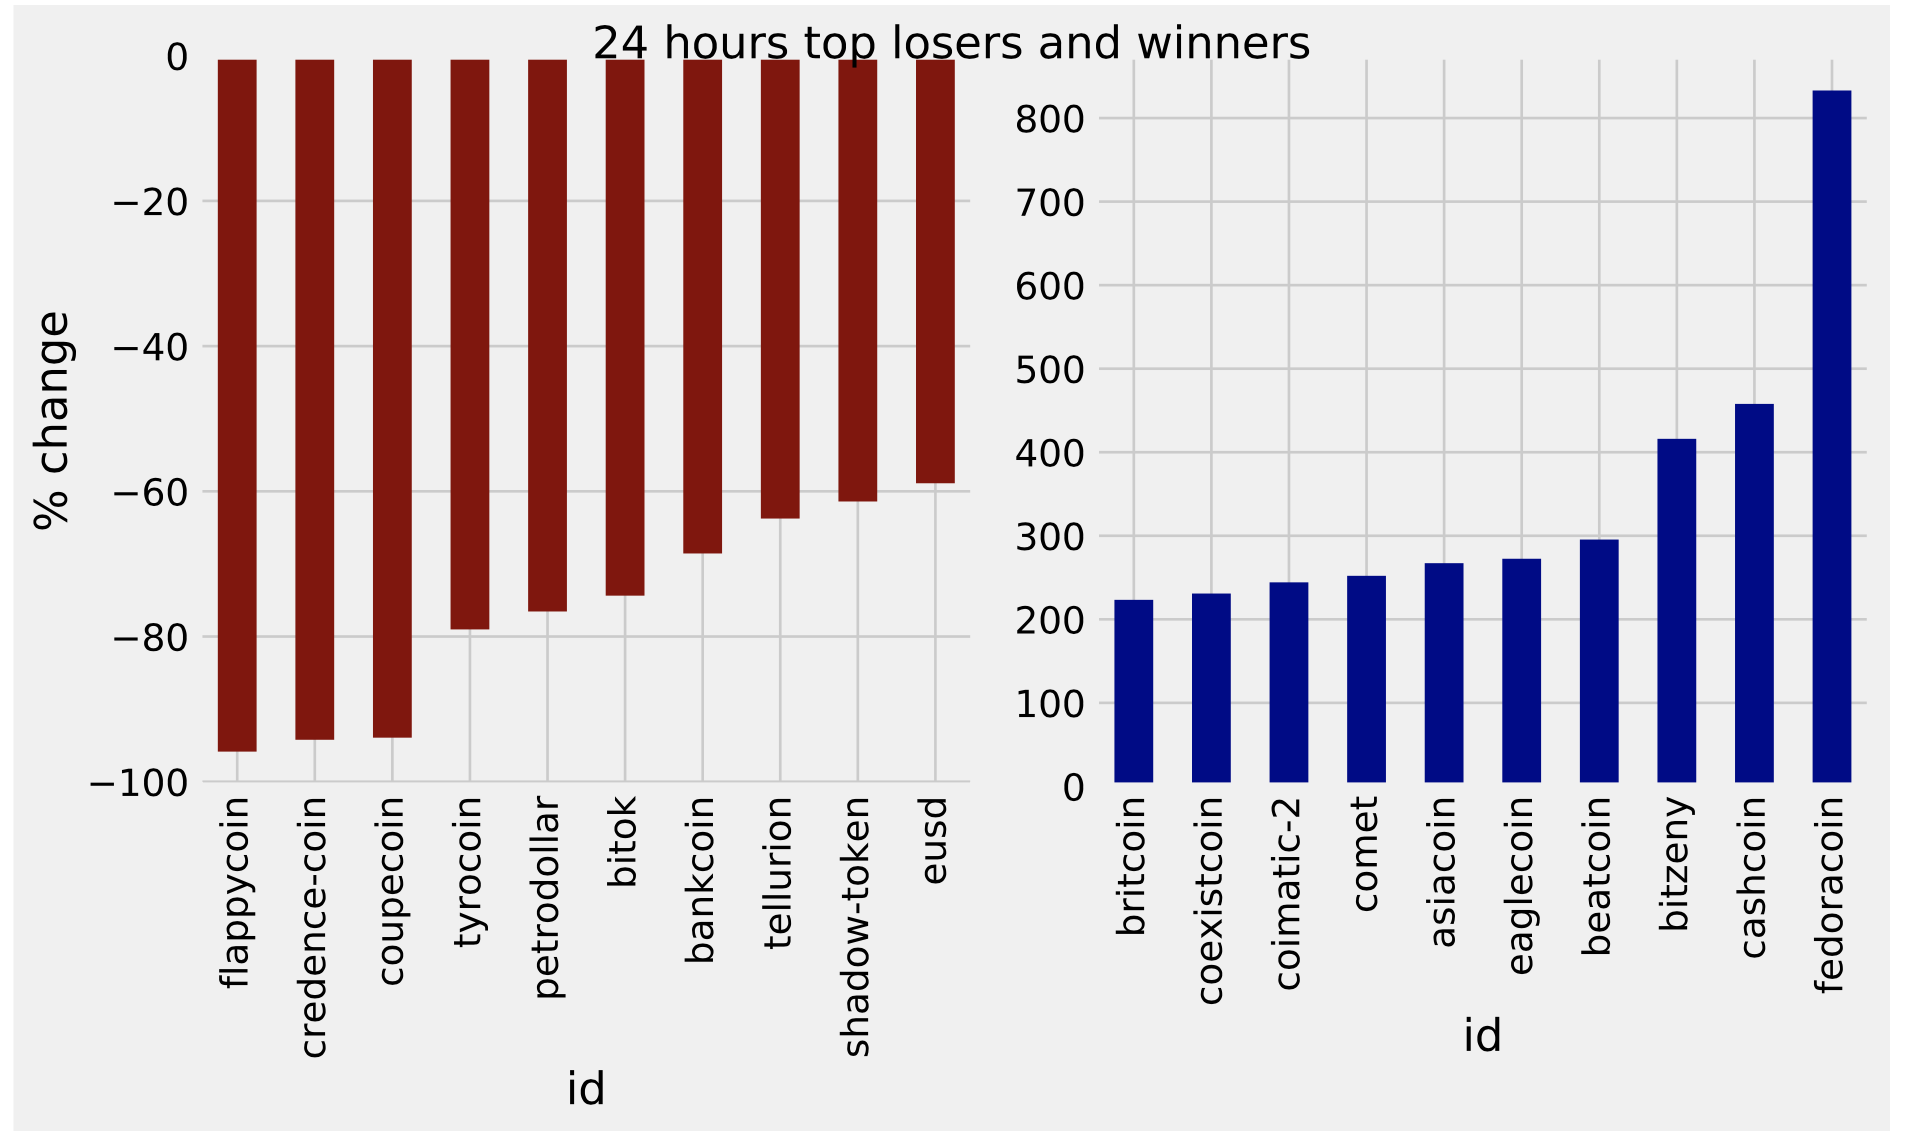
The top 10 biggest gainers and top 10 losers in market capitalization (Daily Stats)
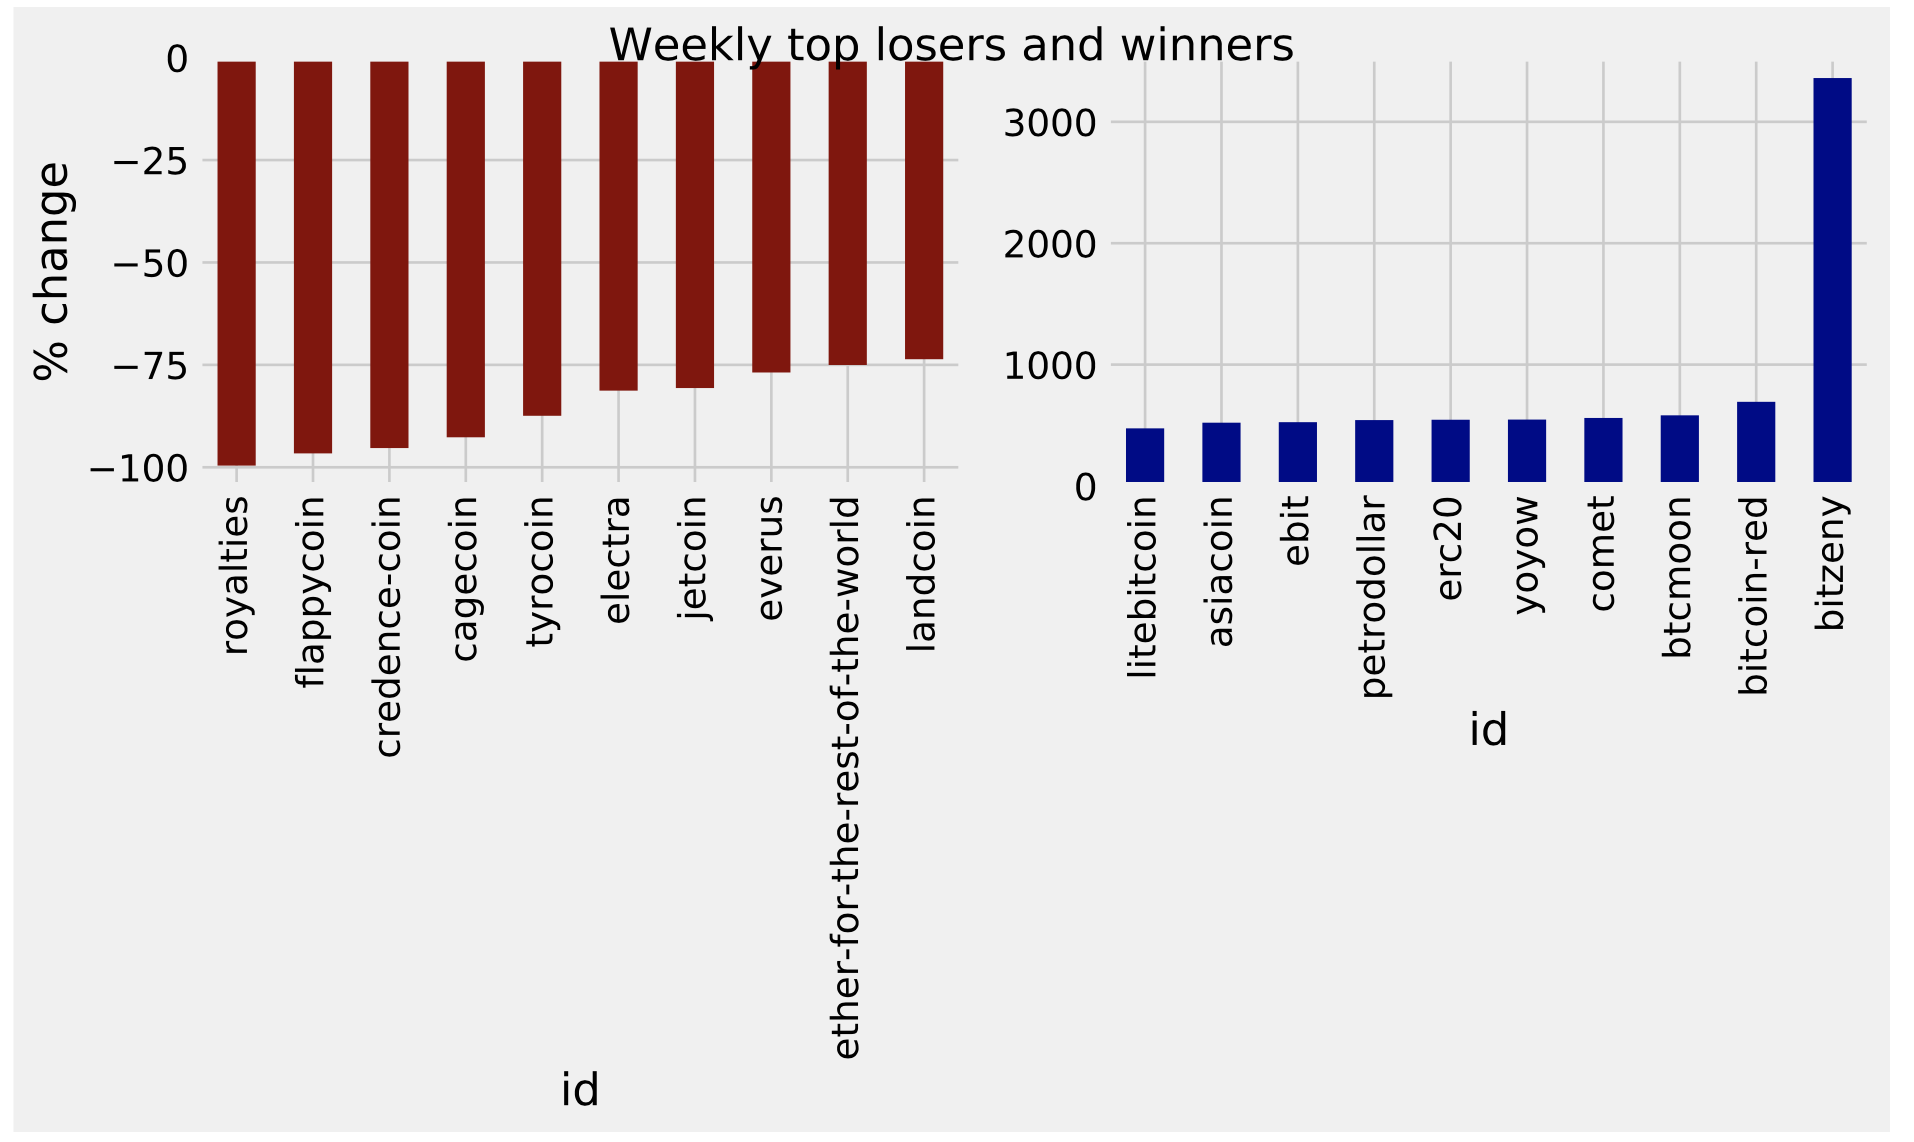
 The top 10 biggest gainers and top 10 losers in market capitalization (Weekly Stats)
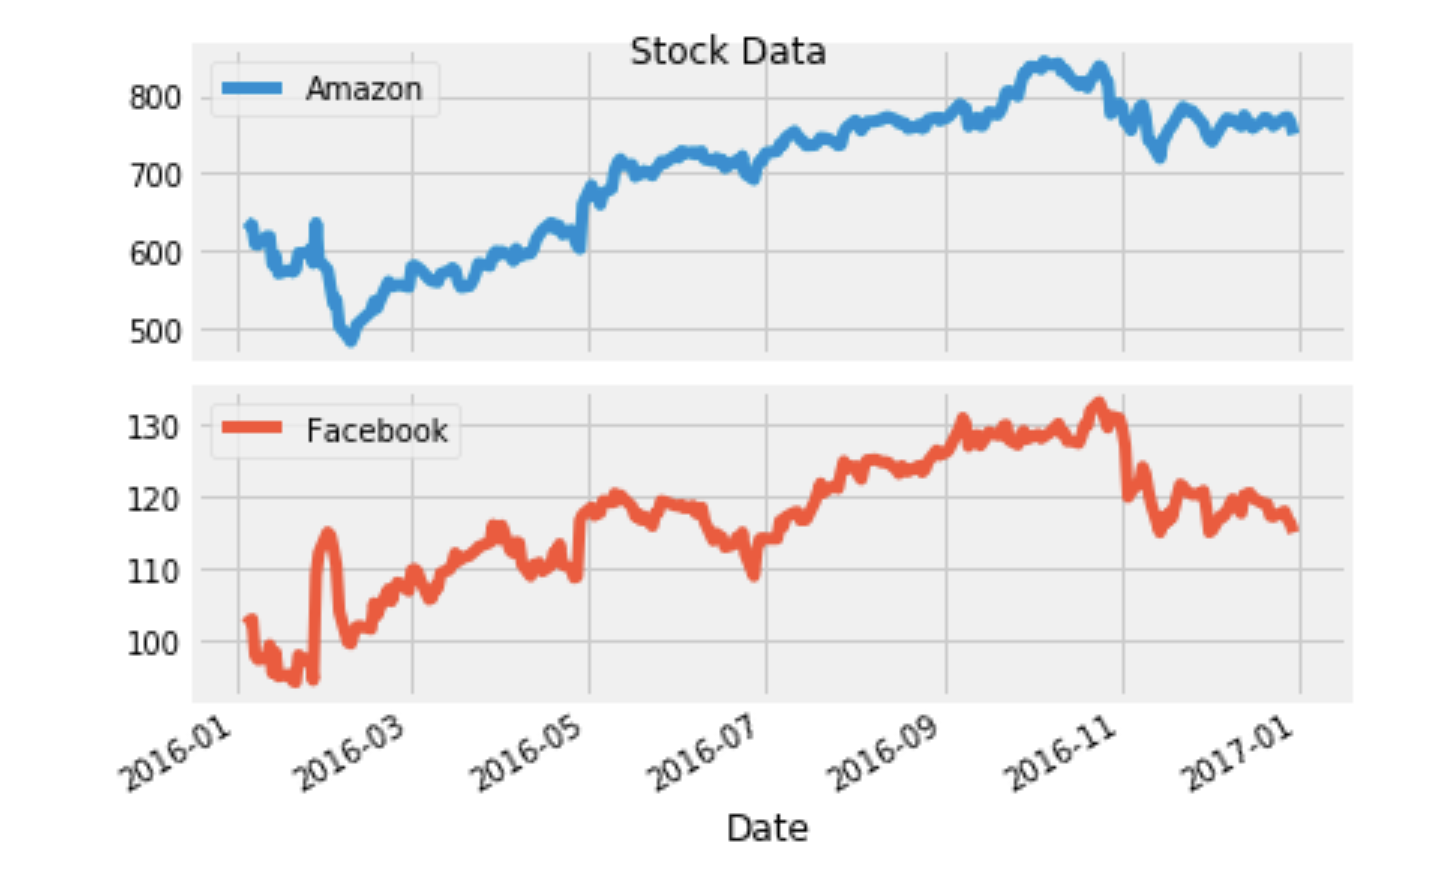
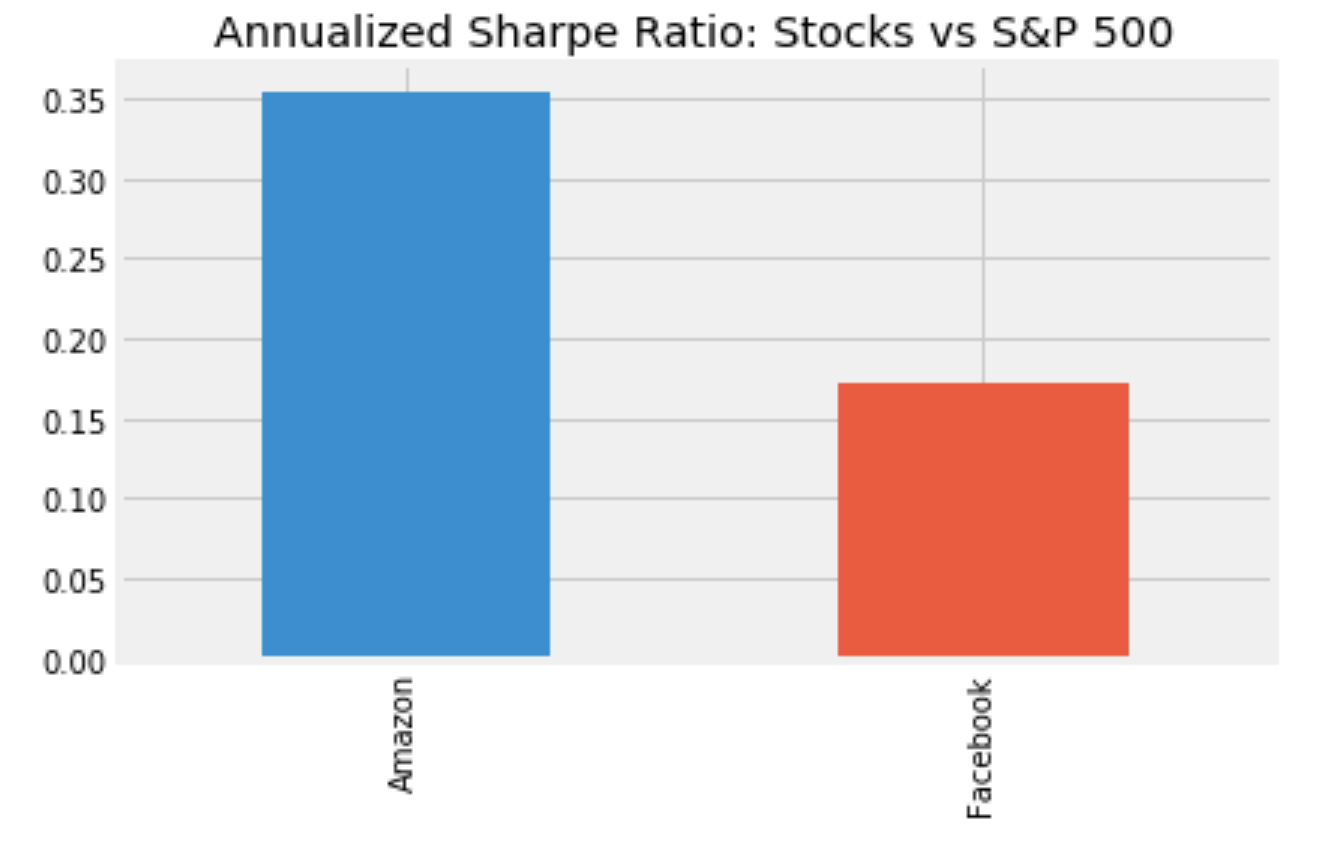
Risk & Return Analysis based on The Sharpe Ratio
The Sharpe Ratio, developed by Nobel Prize winner William Sharpe some 50 years ago. It compares the return of an investment to that of an alternative and relates the relative return to the risk of the investment, measured by the standard deviation of returns. This project provides a brief comparison of the profitability vs risk between Facebook and Amazon Stocks vs the benchmark S&P 500 Index
-
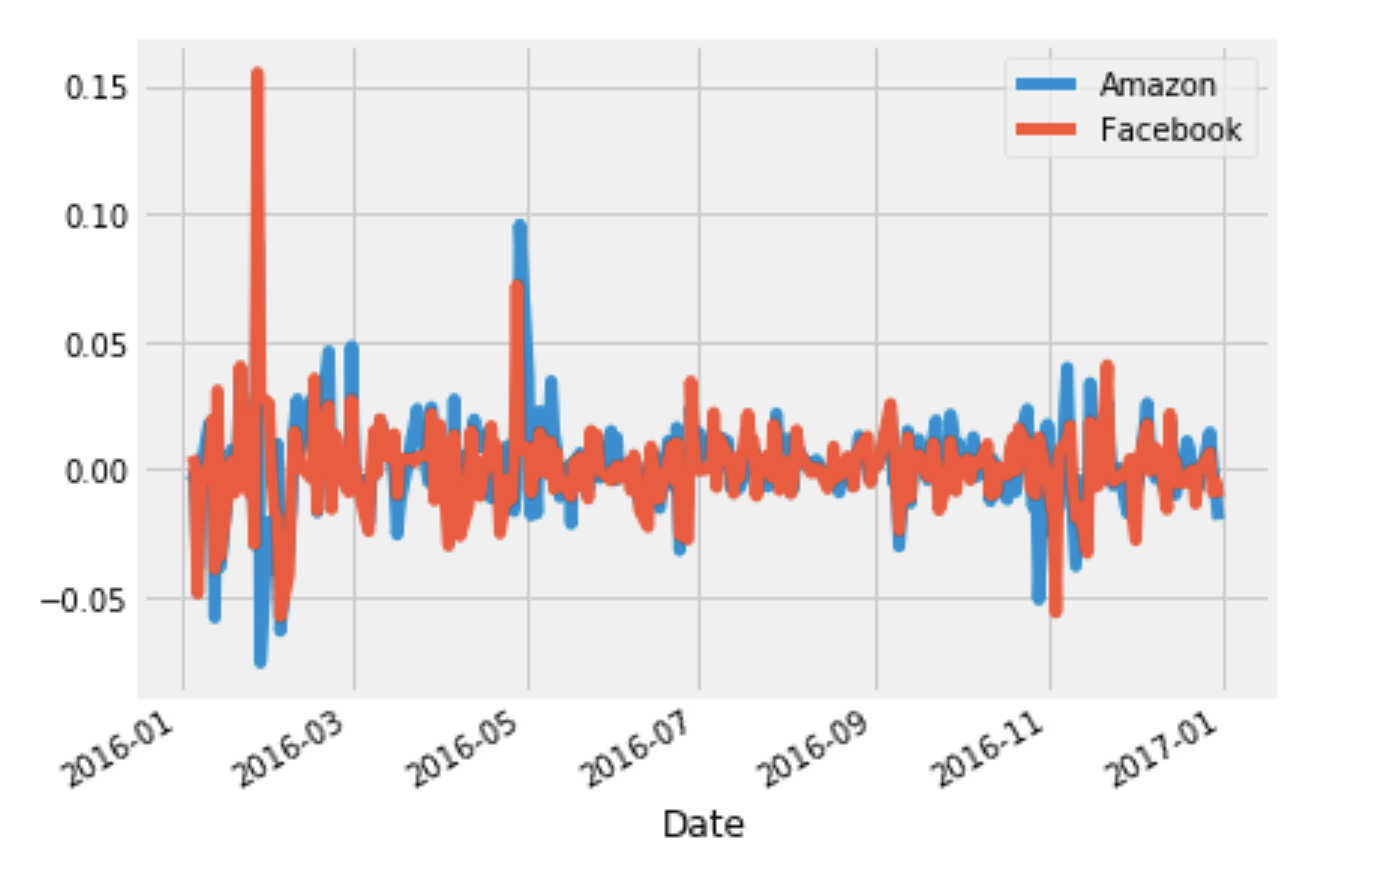
Summarize daily prices for Amazon and Facebook
-
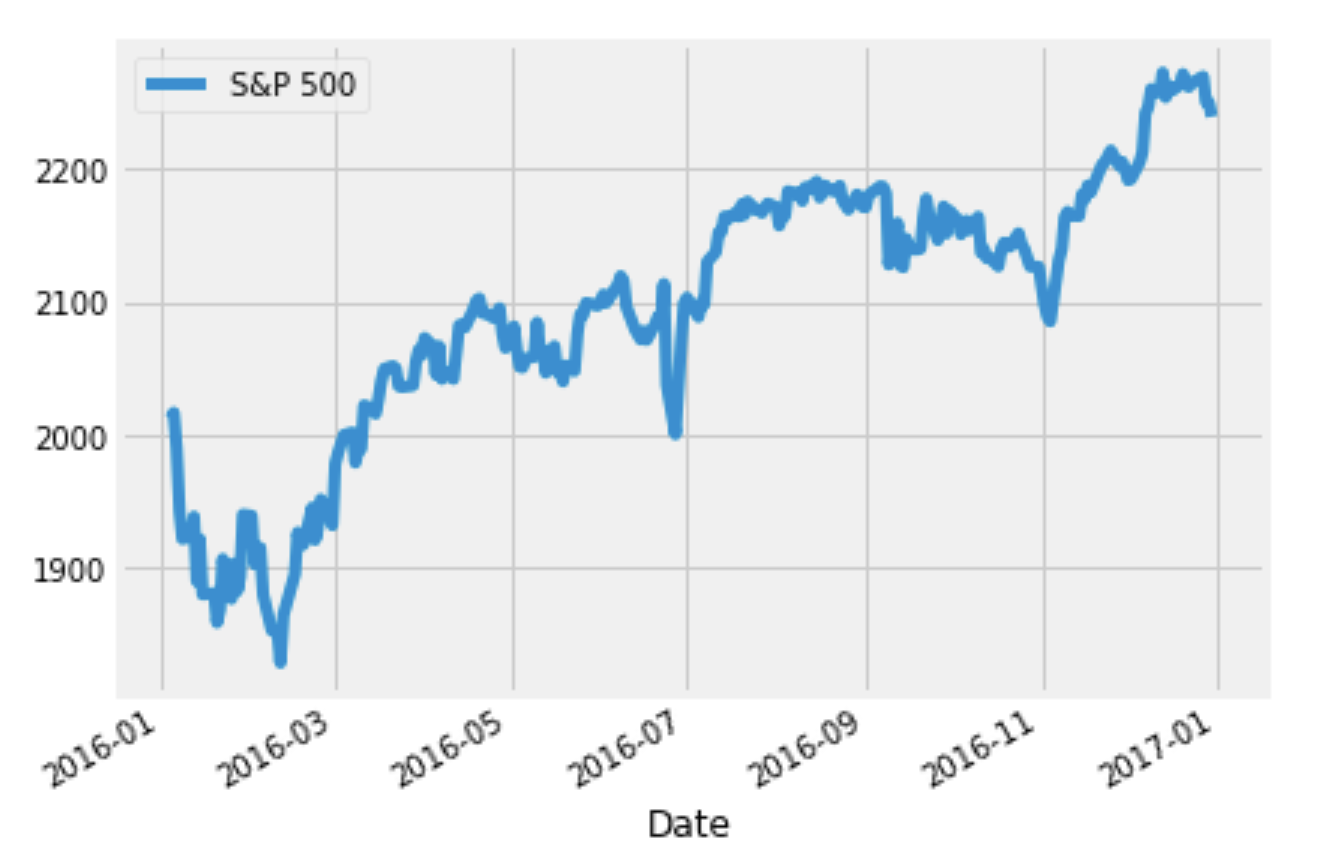
Visualize & summarize daily values for the S&P 500 (the benchmark)
-
The inputs: Starting with Daily Stock Returns: Calculate the percentage change in value from one day to the next
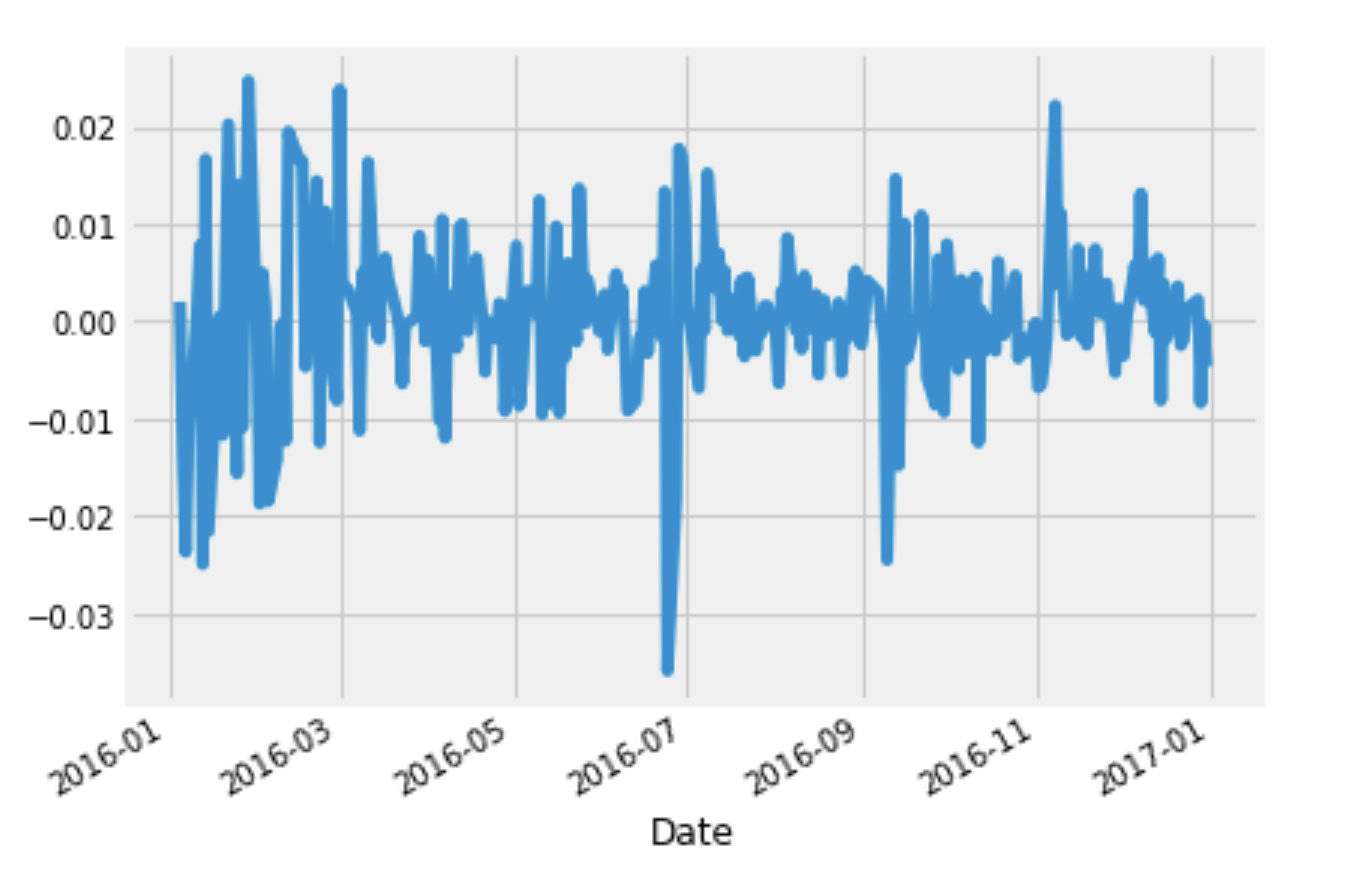
- Daily S&P 500 returns
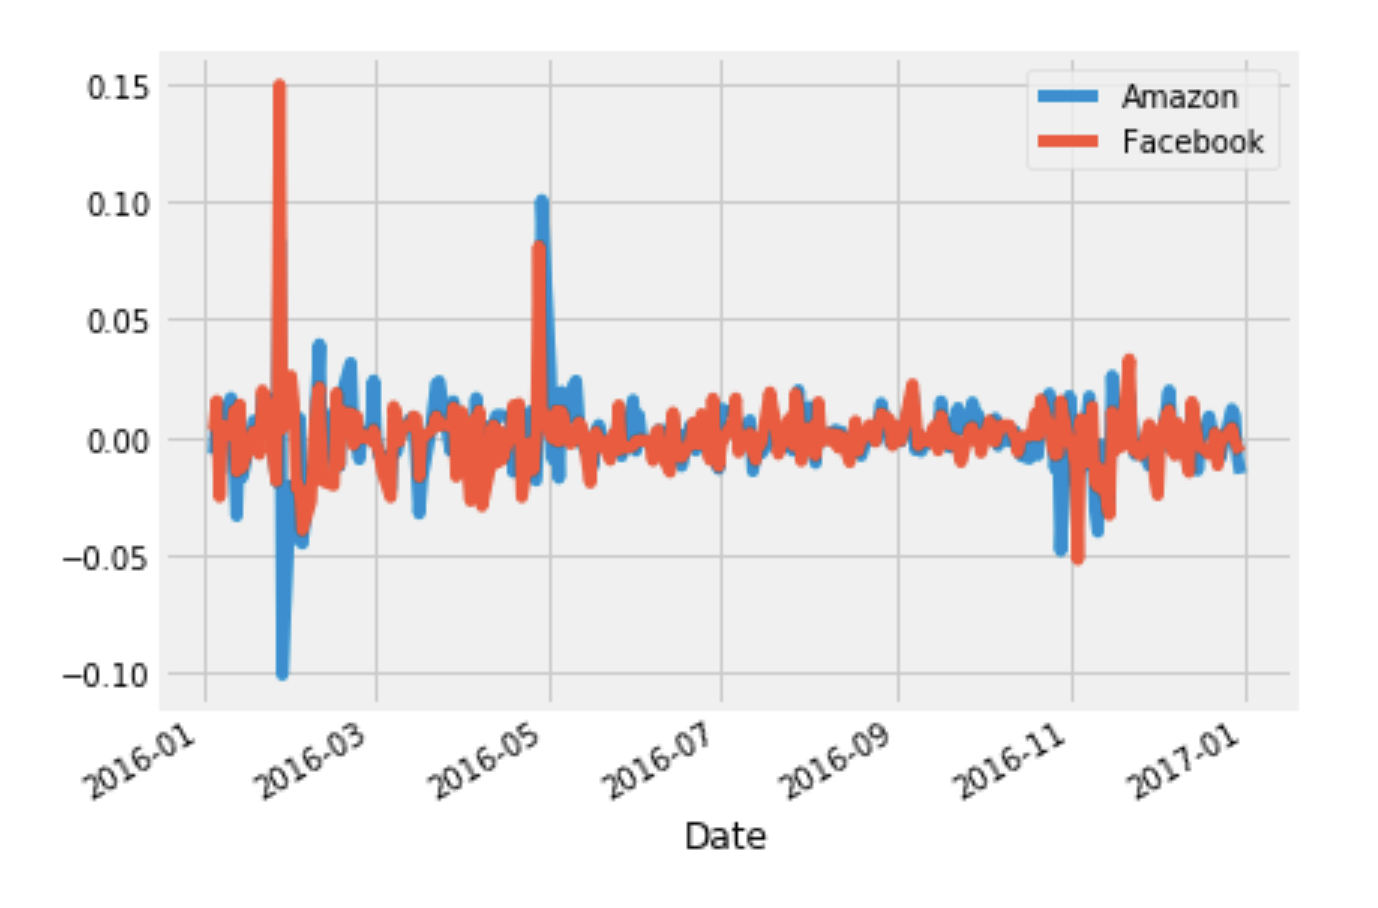
- Calculating Excess Returns for Amazon and Facebook vs. S&P 500
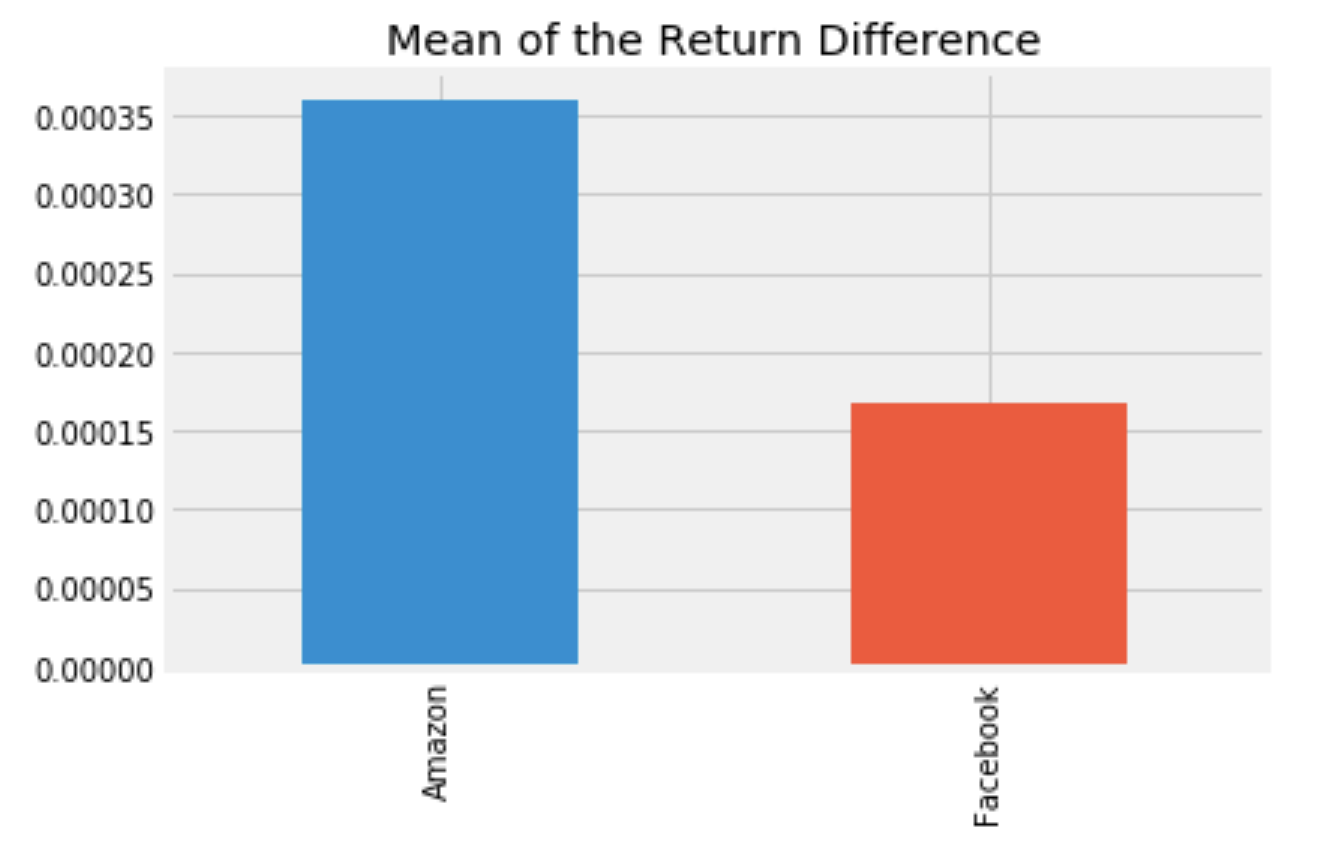
- The Sharpe Ratio, Step 1: The Average Difference in Daily Returns Stocks vs S&P 500
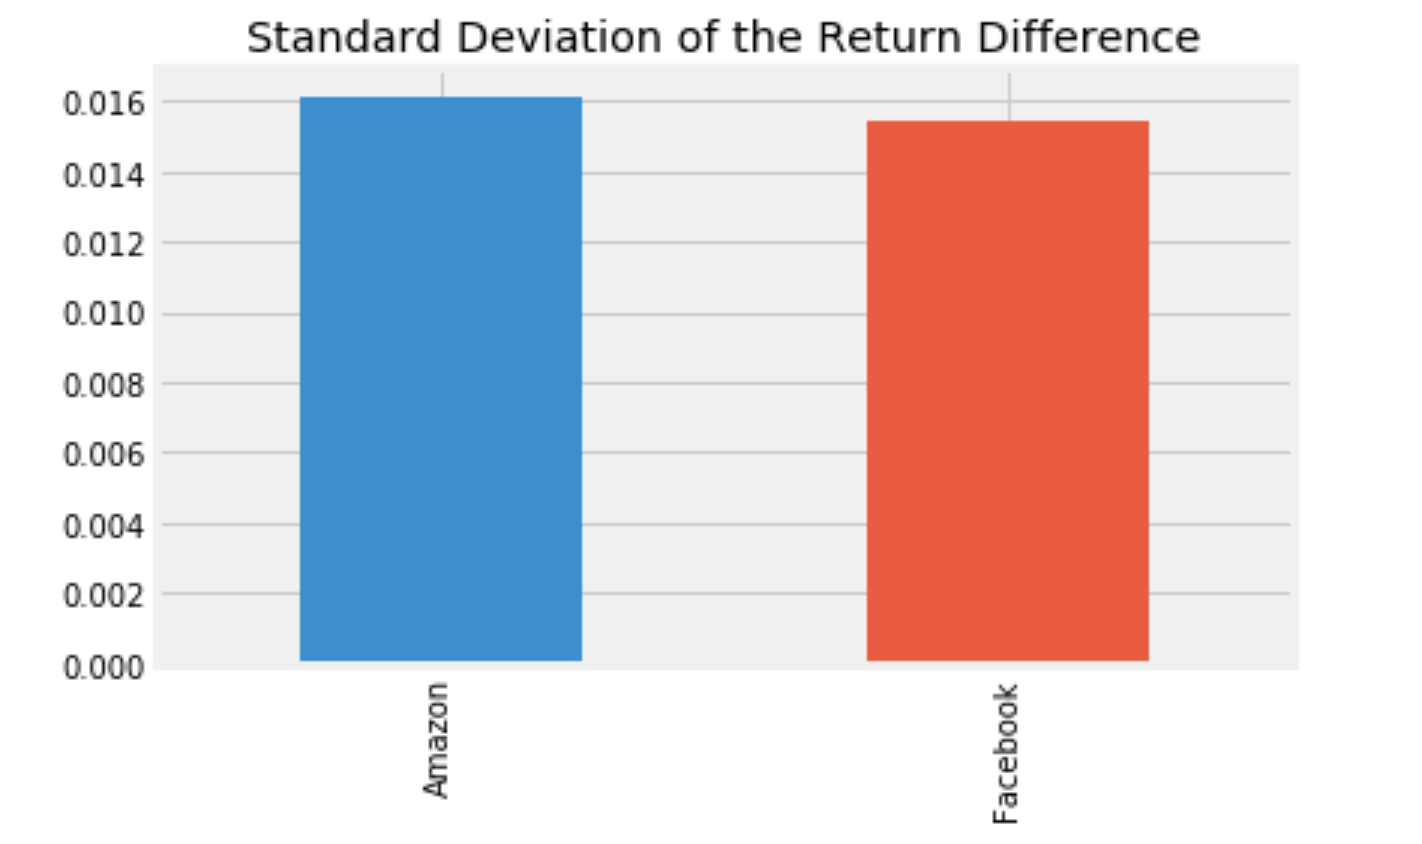
- The Sharpe Ratio, Step 2: Standard Deviation of the Return Difference
- Finalize
Conclusion
An investment in Amazon returned twice as much compared to the S&P 500 for each unit of risk an investor would have assumed. In other words, in risk-adjusted terms, the investment in Amazon would have been more attractive. The Sharpe Ratio helps to make a decision by adjusting the returns by the differences in risk and allows an investor to compare investment opportunities on equal terms, that is, on an ‘apples-to-apples’ basis.
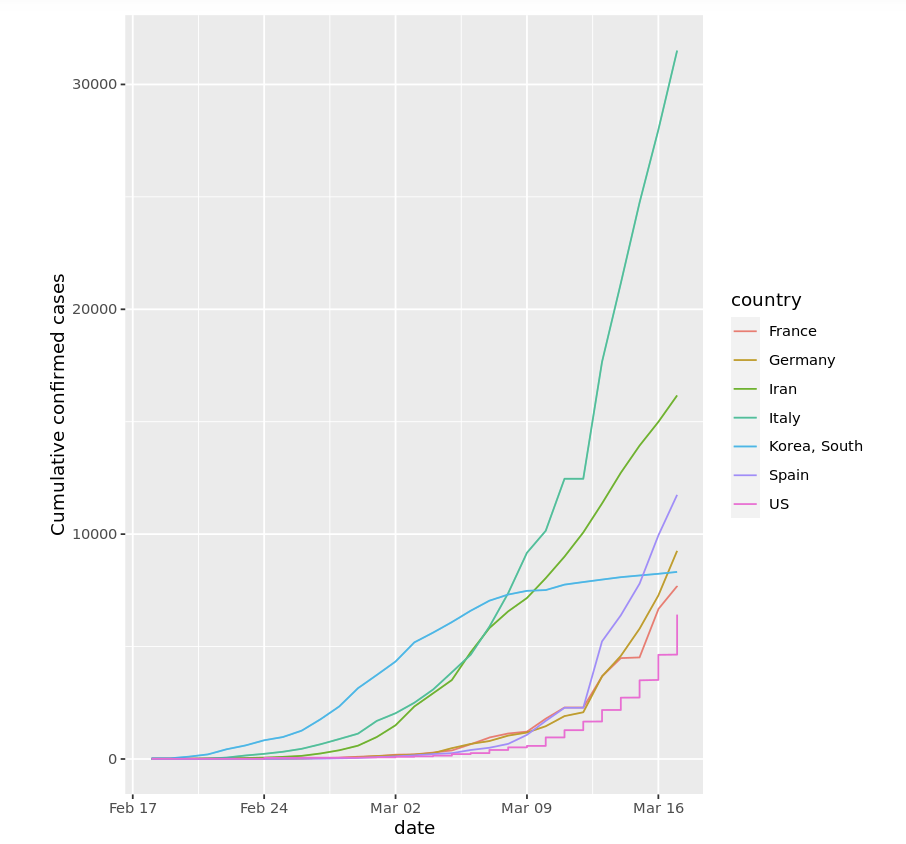
Covid 19 Mid March 2020 Stat
Visualizing hardest hit countries as of Mid-March 2020
Tech Innovation Projects
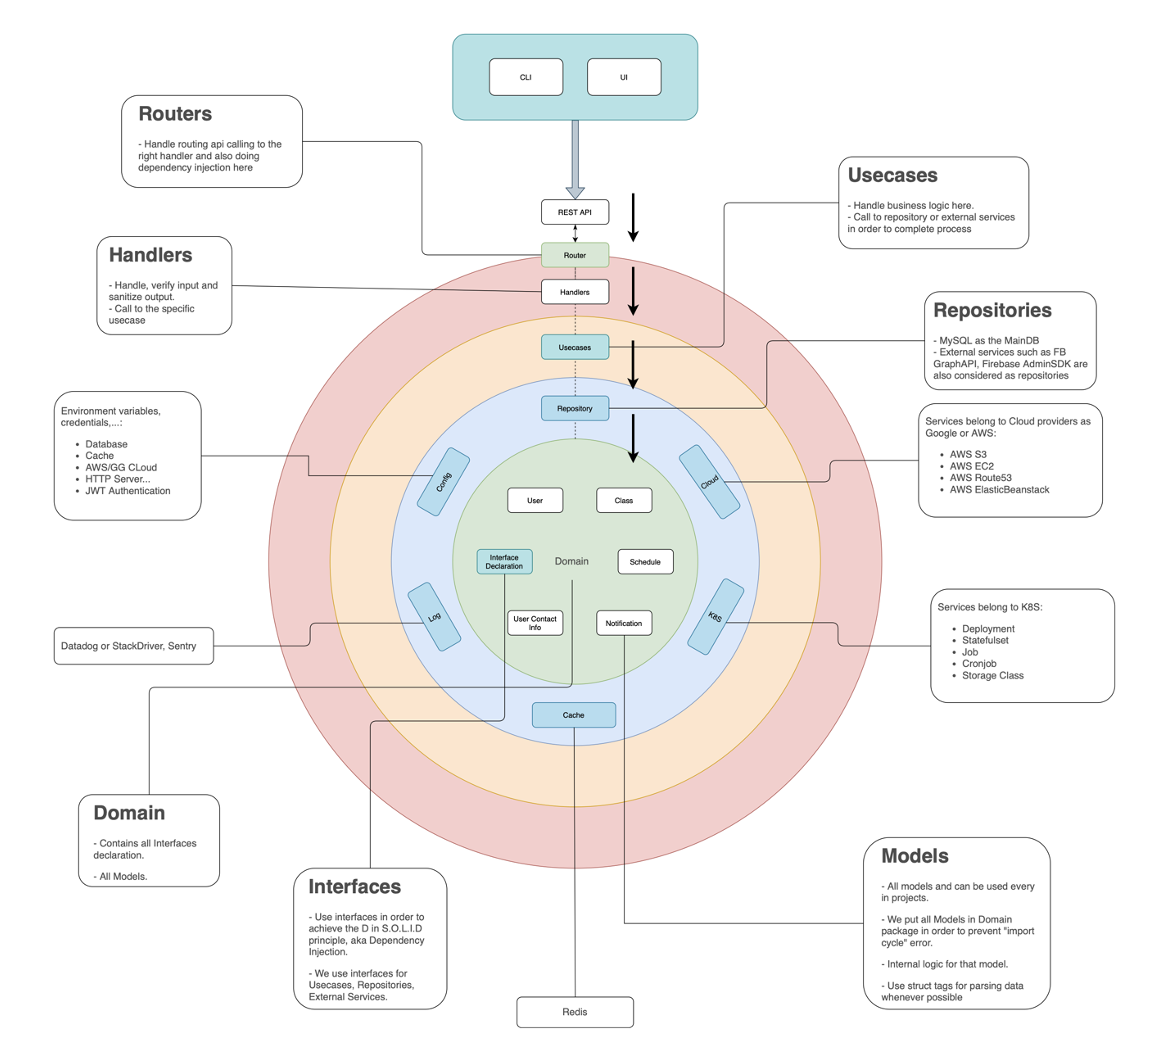
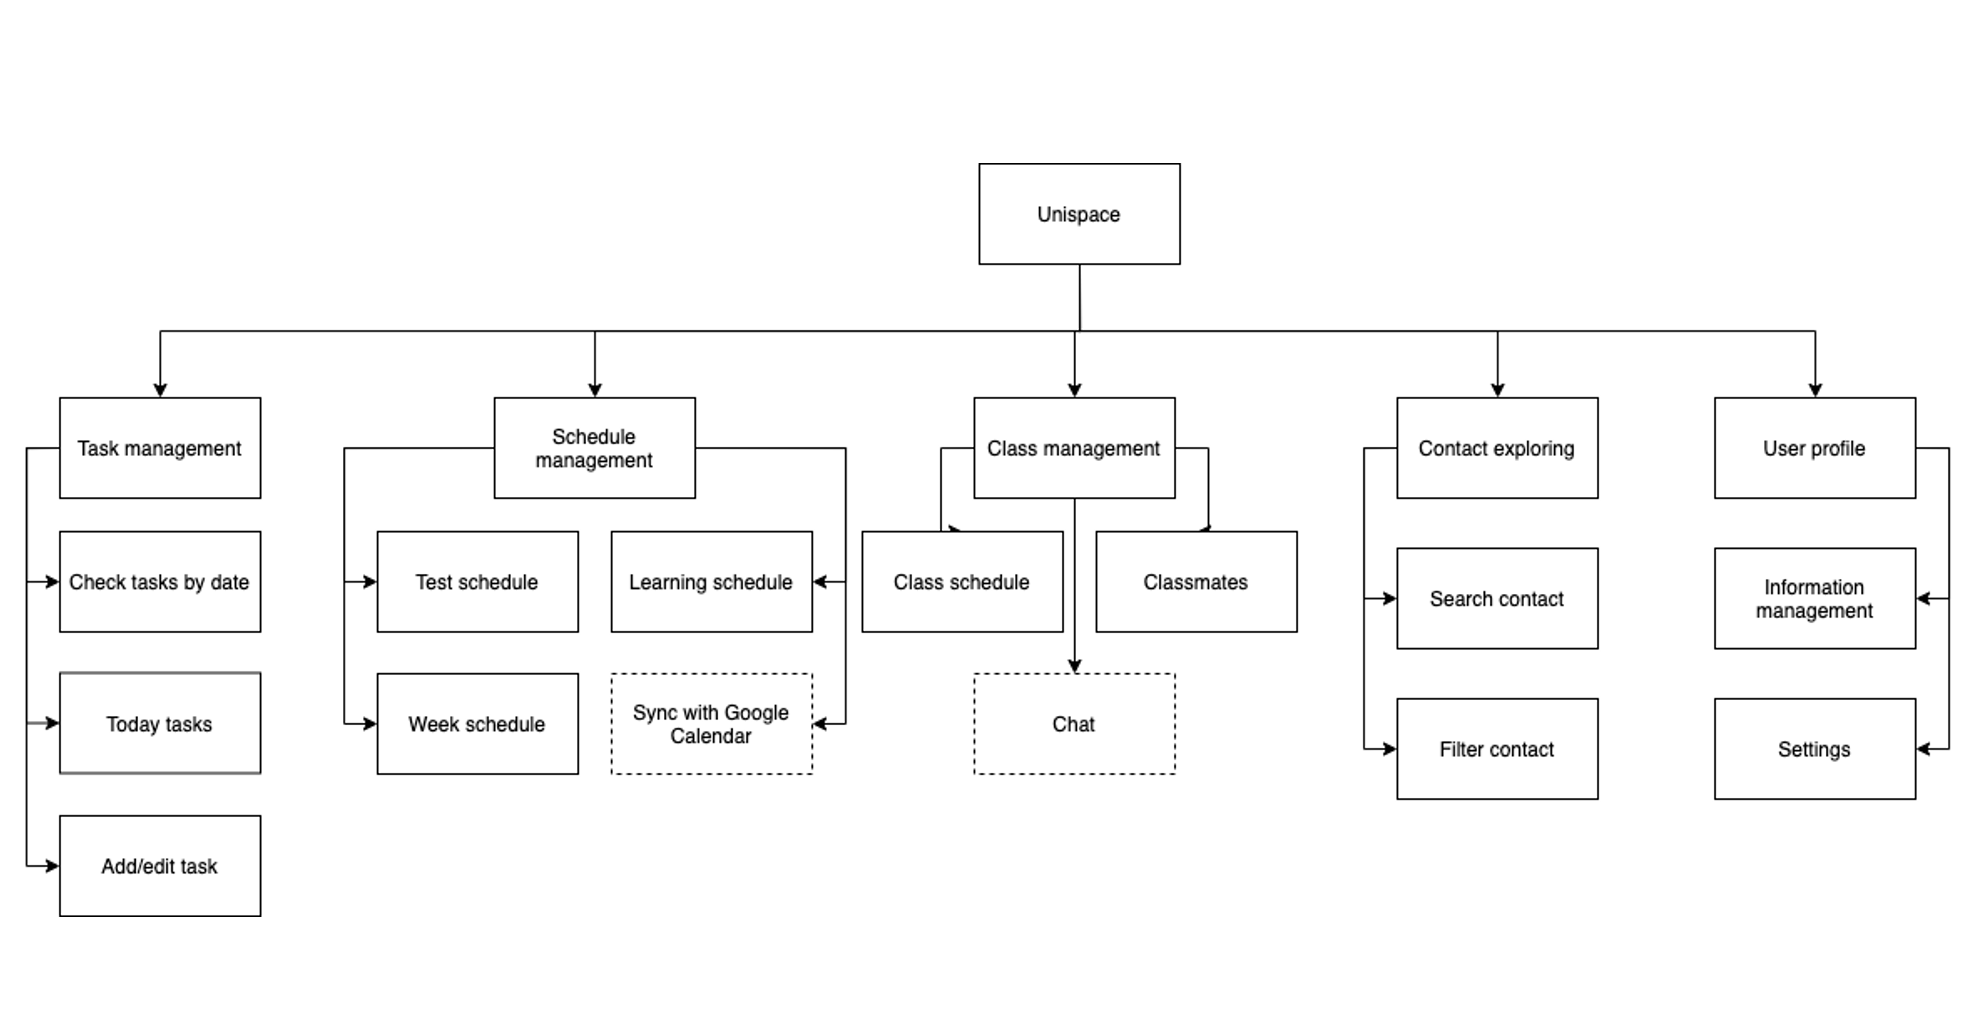
Unispace
An integrated app that leverages digital convergence to support students’ scholastic performance and productivity. It contains class, academic material,
schedule, online search, connections, chat, progress tracking, student profile.
Tech Stack
 MVP Features
 Demo App


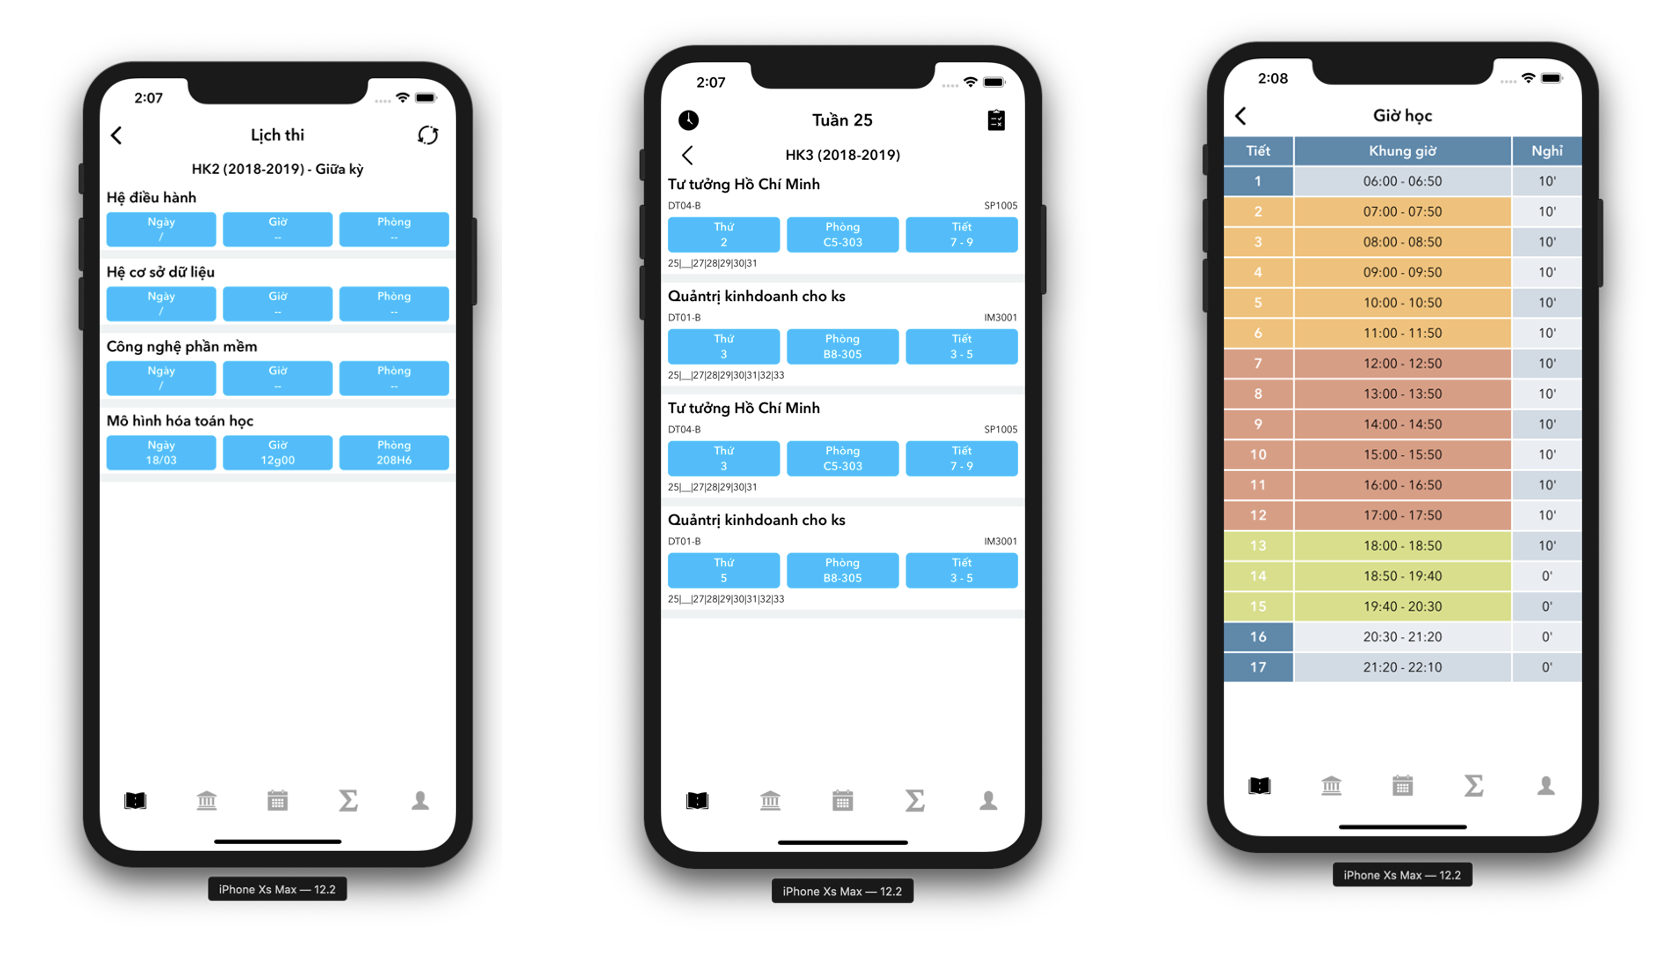
BKSchedule
An older version of Unispace, it was designed for students to help them keep track of overwhelming class and activities schedule
Demo app
 User Interface